Calculating the income statement
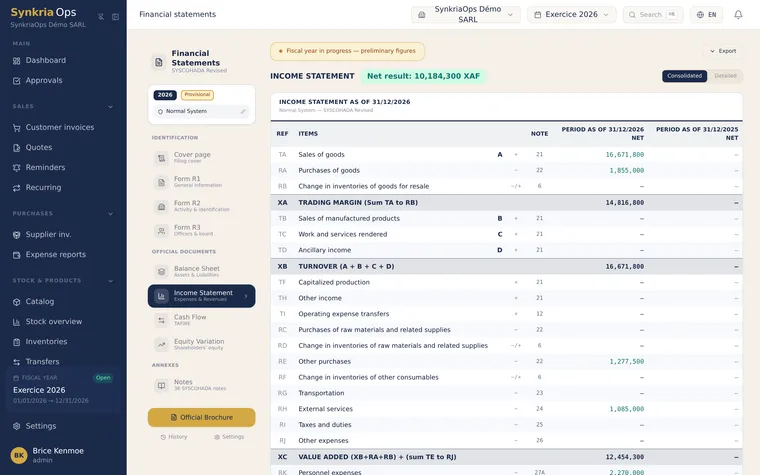
This guide shows you how to generate the income statement — the economic performance of your company over a given period — and how to read the intermediate margin ratios to answer the question: is your business profitable?
Understanding the SYSCOHADA structure
Section titled “Understanding the SYSCOHADA structure”The SYSCOHADA revised 2019 plan distinguishes three main components:
| Section | Accounts | Content |
|---|---|---|
| Ordinary activity revenue | Class 7 | Revenue, grants, provisions written back |
| Ordinary activity expenses | Class 6 | Purchases, staff costs, depreciation, taxes |
| Extraordinary items (HAO) | Class 8 | Exceptional income and expenses |
Net result = Revenue (cl. 7) − Expenses (cl. 6) ± Extraordinary result (cl. 8)
Accessing the income statement
Section titled “Accessing the income statement”From the navigation bar: Financial Statements → Income Statement.
-
Select the fiscal year from the dropdown menu.
-
Adjust the period (start date / end date) for a partial income statement (monthly, quarterly).
-
SynkriaOps automatically calculates all totals from posted documents.
-
Click Export → PDF or Export → Excel to download the report.
Analysing the intermediate margin ratios
Section titled “Analysing the intermediate margin ratios”The intermediate ratios break down the result into stages to pinpoint exactly where in the business profitability is earned or lost.
Gross margin on merchandise
Section titled “Gross margin on merchandise”Gross margin = Merchandise sales (701) − Merchandise purchases (601) − Stock movements (6031)
The gross margin measures the profitability of your trading activity before any overhead. A gross margin rate (margin / revenue) below the sector average signals a pricing or purchasing cost problem.
Output for the period
Section titled “Output for the period”Output = Product sales (702) + Work in progress (73) + Capitalised production (74)
For a pure trading company, output is often zero (only merchandise sales count).
Value added (VA)
Section titled “Value added (VA)”VA = Gross margin + Output − External consumption (602, 604, 605, 606, 61, 62, 63)
External consumption covers all purchased services: rent, telecommunications, transport, professional fees, advertising, insurance. VA measures what the company genuinely creates beyond its suppliers.
Earnings before interest, taxes, depreciation and amortisation (EBITDA / EBE)
Section titled “Earnings before interest, taxes, depreciation and amortisation (EBITDA / EBE)”EBE = VA − Staff costs (64) − Taxes and duties (65)
EBE is the potential cash flow generated by pure operations, before financing and before depreciation. It is the key indicator used by banks to assess debt repayment capacity.
Operating result (EBIT)
Section titled “Operating result (EBIT)”EBIT = EBE − Depreciation and provisions (681, 691)
The operating result incorporates the wear on fixed capital (depreciation). A positive EBIT means the core activity is profitable, regardless of financing structure.
Financial result
Section titled “Financial result”Financial result = Financial income (77) − Financial expenses (66)
Includes loan interest (negative) and investment returns (positive). In practice, most SMEs have a negative financial result because they are repaying loans.
Net result
Section titled “Net result”Net result = EBIT + Financial result ± Extraordinary result − Income tax (89)
This is the result that will be recorded in account 13 of the balance sheet after year-end closing.
Reading a full example
Section titled “Reading a full example”Income statement of a Cameroonian distribution SME with 85,000,000 XAF in revenue:
| Ratio | Amount (XAF) | % of revenue |
|---|---|---|
| Revenue (701) | 85,000,000 | 100.0% |
| − Merchandise purchases (601+6031) | 52,700,000 | 62.0% |
| = Gross margin | 32,300,000 | 38.0% |
| − External consumption (61+62+63) | 8,500,000 | 10.0% |
| = Value added | 23,800,000 | 28.0% |
| − Staff costs (64) | 9,200,000 | 10.8% |
| − Taxes and duties excl. income tax (65) | 1,350,000 | 1.6% |
| = EBE (EBITDA) | 13,250,000 | 15.6% |
| − Depreciation (681) | 2,800,000 | 3.3% |
| = Operating result (EBIT) | 10,450,000 | 12.3% |
| + Financial income (77) | 120,000 | 0.1% |
| − Financial expenses (66) | 1,640,000 | 1.9% |
| = Result before tax | 8,930,000 | 10.5% |
| − Income tax (89) | 1,430,000 | 1.7% |
| = Net result | 7,500,000 | 8.8% |
Resolving a gap between result and account 13
Section titled “Resolving a gap between result and account 13”If the result shown in the income statement differs from the balance of account 12 in the trial balance, common causes are:
| Observed discrepancy | Likely cause | Solution |
|---|---|---|
| Income statement result > account 13 balance | Class 6 or 7 documents are still in DRAFT | Post the missing documents |
| Income statement result < account 13 balance | A manual journal entry has been posted to account 13 outside the closing process | Check the general ledger of account 13 |
| Unexpectedly negative result | Incorrect opening balances — N-1 expenses have been carried forward | Check the AN journal in the general ledger |
| Zero result mid-year | Normal — account 13 is only populated at year-end closing | No action required |
Fixing common errors
Section titled “Fixing common errors”| Error | Cause | Solution |
|---|---|---|
| Revenue understated | Invoices in DRAFT or not posted | Post all invoices for the period |
| Zero staff costs | Payroll entries not recorded | Post payroll documents (641, 642 accounts) |
| Negative EBE | Overhead too high relative to gross margin | Analyse external consumption line by line |
| Empty income statement | No posted documents in the period | Check the period filter and document statuses |
See also
Section titled “See also”- Calculating the SYSCOHADA balance sheet — The net result calculated here is the same figure that appears in account 13 of the balance sheet after closing.
- Calculating the TFT — The TFT explains how net result translates into actual cash flows.